Search This Blog

Wednesday, 21 September 2016

Money crack in an old PC game

The following post was written for educational purposes only. Please don't ask for any cracked executables from me.

In a recent article of mine, I’ve shown you how WinDbg can assist you in cheating. Today, I wanna show you how to go one step further, i.e. to modify your executable in order to circumvent some logic, like the one decreasing your gold when buying something. Of course, this could be easily achieved by attaching WinDbg to DOSBox and creating a breakpoint at the address where the money is stored with an automatic command that rewrites the value. However, my intention is to circumvent the logic that subtracts the cost of items from our money without a debugger attached.
The game of my choice is Gods from 1991 by The Bitmap Brothers. What an awesome game it was. My brother and I used to play it a lot when we were kids. We knew most of the levels by heart. Even today it is a game I can enjoy. If you don’t know it, you have to give it a try, trust me!

DOSBox

As this is an old game running in 16-bit real mode, you won’t be able to start it on modern systems w/o an emulator so I decided to use the most popular one – DOSBox. If you’re not a command-line geek, you might want to check the available frontends for it. I can only recommend D-Fend as it is very easy to use and exposes many configuration options via a nice GUI.
Okay, let’s start the game in DOSBox. I’ve already played thru the 1st part of the game, so I had the password for the temple region. Enter DYJ and we’re in the shop. That’s exactly what we need for testing. And WinDbg. Attach to the dosbox process and as our starting money is 80000, let’s look for that value in memory.
0:000> !address -c:"s -d %1 %2 0n80000"
005c12f0  00013880 7d81187f 01388010 8b0f7f00  .8.....}..8.....
005c13cc  00013880 458b0f7f 1c450320 0186a03d  .8.....E .E.=...
005c1420  00013880 7d81187f 01388028 8b0f7f00  .8.....}(.8.....
08af3324  00013880 0018000e e646ffff 020dffff  .8........F.....
08af33e4  00013880 000cffff 01c20000 00000000  .8..............


There are 5 occurrences. But what if I buy a fireball for 12500 and check again?
0:000> !address -c:"s -d %1 %2 0n67500"
043240b0  000107ac 000009bc 000004e4 00000000  ................
08af3324  000107ac 0018000e e646ffff 020dffff  ..........F.....
08af33e4  000107ac 000c00c2 01c20000 ffffd1b6  ................


Still 2 matches compared to the previous results? Okay, I got it! As the money gradually (not instantly) decreases from 80000 to 67500, I figure the game stores the "from", "actual" and "to" values and when "actual" becomes "to" over time, "from" is set to "to". Makes sense, right? :-)
So let’s choose the first address and reset the value it holds to 80000.
0:000> ed 08af3324 0n80000
0:000> g


Great, the money rolled back to 80000. So this is the memory address of "to". Now we need to find the code that modifies it.
0:000> ba w4 08af3324
0:000> g


Buy the same item again, and….
Breakpoint 0 hit
eax=08ae0020 ebx=00013304 ecx=000007ac edx=00000013 esi=00000304 edi=00000304
eip=00487cc1 esp=0028b460 ebp=000031a0 iopl=0         nv up ei pl nz na po nc
cs=0023  ss=002b  ds=002b  es=002b  fs=0053  gs=002b             efl=00000202
DOSBox+0x87cc1:
00487cc1 8b35c8b07400    mov     esi,dword ptr [DOSBox!LoadDLS+0x194828 (0074b0c8)] ds:002b:0074b0c8=0000008a


As cs:Eip now points to the instruction after the one triggering the breakpoint, let's find the one that caused the bp hit.
0:000> u eip-4 L2
DOSBox+0x87cbd:
00487cbd 66890c18        mov     word ptr [eax+ebx],cx
00487cc1 8b35c8b07400    mov     esi,dword ptr [DOSBox!LoadDLS+0x194828 (0074b0c8)]


Hmm… the instructions use 32-bit registers. That’s pretty unusual for a 16-bit game.. what’s going on here?! After doing some research I realized that DOSBox works as an interpreter, i.e. it reads the instructions from the original executable and translates them to 32-bit protected mode stuff. The callstack also confirms this, as there’s no sign of gods.exe or game.exe in it.
0:000> k
# ChildEBP RetAddr  
WARNING: Stack unwind information not available. Following frames may be wrong.
00 0028b478 00567c60 DOSBox+0x87cc1
01 0028b498 004acbb7 DOSBox+0x167c60
02 0028b4a8 6813eb12 DOSBox+0xacbb7
03 0028b4b0 76c6149d SDL!SDL_RegisterApp+0xaeb2
04 0028b518 76c614d0 KERNELBASE!WaitForSingleObjectEx+0x98
05 0028b588 0040129f KERNELBASE!WaitForSingleObjectEx+0xcb
06 0028b5d8 00401646 DOSBox+0x129f
07 0028b5e8 004162d7 DOSBox+0x1646
08 0028b5f8 0058b179 DOSBox+0x162d7
09 0028b5fc 00000000 DOSBox+0x18b179


Conclusion: it makes no sense to look for the opcode bytes in the game executable(s). We have to find a way to debug the original code, not the transformed one. This is where the DOSBox Debugger comes into play.

The DOSBox Debugger

In order to use the debugging features of DOSBox, you have to either re-compile it for yourself with some special switches or be smart and download it from somewhere. :-) I went for the 2nd approach.
http://source.dosbox.com/dosbox-74-debug.exe
Now let’s start the game from the debugger and navigate to the shop screen again. Then press Alt+Pause to break into the debugger.
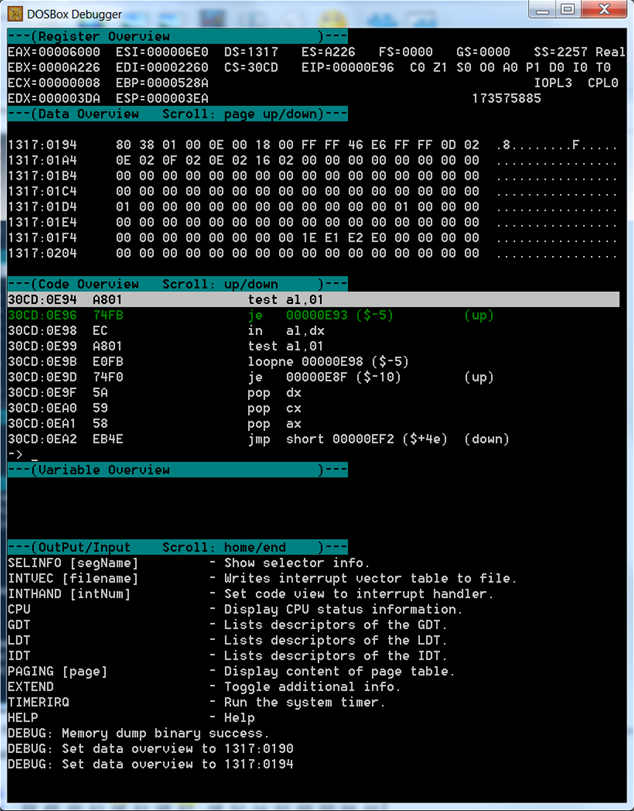
We need to find 80000 (0x00013880) in memory…hmmm..there seems to be no built-in support to search for data in memory. You have to dump the contents of a memory region to a binary file and look for the value with your favourite hex editor.
-> MEMDUMPBIN DS:0 10000

This command dumps 64K data to a file named "memdump.bin".
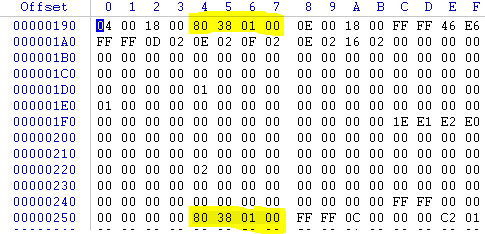

The fact that there are 2 memory addresses again holding this value nicely corresponds with what we've seen in WinDbg. We can adjust the data overview region to start with this address:
-> D 1317:194

Now let’s buy a fireball and… the value changes at 1317:194 accordingly. Good, so now we know the address of "to" for sure, let’s reset it to 80000.
-> SM 1317:194 80 38 01 00

Now we define a breakpoint for this address.
-> BPM 1317:194

Buy the fireball again and the breakpoint is hit. Check the previous and current instructions in the code overview area.

Gotcha'! These two instructions are responsible for decreasing our money. All we have to do is find the opcode bytes (0x29 0x06 0x94 0x01 and 0x83 0x1E 0x96 0x01 0x00) in the executable and replace them with nop instructions (0x90).
I've already noticed that even though the game is started with gods.exe, there's also a game.exe. I wanted to make sure and scanned through all files in the game folder for the opcodes but no luck. Hmm… I feel so close to the solution, what now?
Checking the game.exe header revealed the last piece of information missing. Game.exe was packed with pklite, a common exe packer from that era.


There are several tools to unpack / repack, let's use unp for this purpose. After that the opcodes finally reveal themselves. Change them all to 0x90 and don't bother with repacking. Now run the game and…. EVERYTHING IS FOR FREE IN THE SHOP! YAAAAYYYYY!!!!
How cool is that? ;-)

References:

http://www.vogons.org/viewtopic.php?t=7323
http://www.vogons.org/viewtopic.php?t=3944
https://defuse.ca/online-x86-assembler.htm
https://www.onlinedisassembler.com/odaweb/

Monday, 12 September 2016

Blogs that proved to be invaluable

I’ve been following a couple of technical blogs in the last couple of years and decided to collect them here and provide some keywords that more or less describe their contents. I’m gonna omit keywords that are too general, like C++, C# or .NET and focus on more specific stuff instead.
It’s really great to have such people out there who spend their valuable time writing down these little details for us. A big THANK YOU is the least they deserve.
If you’re a developer, I encourage you to at least have a glimpse, you won’t be disappointed.
I'm sure there are lots of other great blogs out there, this collection reflects only the ones that I have personal experience with.
Happy learning!


Author
Keyword(s)
Site
Alois Kraus
ETW, WPT, WinDbg, Performance
Bruce Dawson
ETW, Performance
Chuck Walbourn
DirectX
Kenny Kerr
Direct2D, Modern C++
Maoni Stephens
CLR Garbage Collector
NtDebugging Blog
Speaks for itself
Sasha Goldshtein
ETW, WinDbg, Performance
Tess Ferrandez
WinDbg
Vance Morrison
ETW, PerfView
Visual C++ Team Blog
Speaks for itself


Monday, 22 August 2016

What killed my message loop?

Every once in a while, I find myself in situations where I have to put most of my debugging skills into action. The reasons vary, however one of the worst is when you make decisions based on false assumptions. These are extremely dangerous as they not only make the process of debugging much longer they might also lead to wrong conclusions and dead ends.
Some colleagues of mine asked for my help the other day. The software we develop displays a login dialog at startup. Pressing Cancel is supposed to close the application but the process was said to remain in memory thereafter. While the login screen is visible, several components start initializing, so that we gain some performance after successful authentication. The application itself is very complex, but it's basically a mixture of WinForms and Silverlight. Again because of performance reasons, the app utilizes 2 UI threads, one for WinForms (Thread A from now on) stuff and another for the Silverlight plugins (Thread B). The latter is created using very similar code to this:
Thread t = new Thread(() =>
{
    //Do some initialization stuff, like creating a WebBrowser control for the Silverlight content

    //Enter message loop
    System.Windows.Forms.Application.Run();
});

t.SetApartmentState(ApartmentState.STA);
t.Start();


Of course the message loop has to be stopped eventually and that we do during the disposal of our component:
protected override void Dispose(bool disposing)
{
    if (disposing)
    {
        //Run this on the message loop thread
        Application.ExitThread();
    }
}


Okay, so as I said, cancelling the login dialog did not result in process termination, which implied that a foreground thread got stuck, so first I checked the threads and call stacks with WinDbg and found 2 points of interest.
First of all, there was no sign of Thread B. What the heck?
Secondly, Thread A seemed to be in the middle of waiting for an operation to complete.
0:008> !clrstack
OS Thread Id: 0xe24 (8)
Child SP       IP Call Site
05a2e4cc 7757019d [HelperMethodFrame_1OBJ: 05a2e4cc] System.Threading.WaitHandle.WaitOneNative(System.Runtime.InteropServices.SafeHandle, UInt32, Boolean, Boolean)
05a2e5b0 6ebac7c1 System.Threading.WaitHandle.InternalWaitOne(System.Runtime.InteropServices.SafeHandle, Int64, Boolean, Boolean)
05a2e5c8 6ebac788 System.Threading.WaitHandle.WaitOne(Int32, Boolean)
05a2e5dc 69414e7e System.Windows.Forms.Control.WaitForWaitHandle(System.Threading.WaitHandle)
05a2e61c 697e3b96 System.Windows.Forms.Control.MarshaledInvoke(System.Windows.Forms.Control, System.Delegate, System.Object[], Boolean)
05a2e620 6941722b [InlinedCallFrame: 05a2e620]
05a2e6a4 6941722b System.Windows.Forms.Control.Invoke(System.Delegate, System.Object[])
05a2e6d8 694171dc System.Windows.Forms.Control.Invoke(System.Delegate)
...
05a2e77c 6e0b501a System.ComponentModel.Component.Dispose()
05a2e788 697df58c System.Windows.Forms.Form.Dispose(Boolean)
...
05a2e7f8 6e0b501a System.ComponentModel.Component.Dispose()
05a2e804 7086d5df Microsoft.Practices.ObjectBuilder.LifetimeContainer.Dispose(Boolean)
05a2e84c 7086d541 Microsoft.Practices.ObjectBuilder.LifetimeContainer.Dispose()
05a2e854 6a5a99ca Microsoft.Practices.CompositeUI.WorkItem.Dispose(Boolean)
...


Okay, so it seems we try to invoke a delegate synchronously with Control.Invoke(), but what is the runtime type of this Control?
0:008> !dso
OS Thread Id: 0xe24 (8)
ESP/REG  Object   Name
05A2E3D0 024a72d8 System.Windows.Forms.WindowsFormsSynchronizationContext
05A2E428 12302034 Microsoft.Win32.SafeHandles.SafeWaitHandle
05A2E4C0 12302034 Microsoft.Win32.SafeHandles.SafeWaitHandle
05A2E4F0 12302034 Microsoft.Win32.SafeHandles.SafeWaitHandle
05A2E53C 0275c894 System.Windows.Forms.WebBrowser
...

0:008> !clrstack -a
OS Thread Id: 0xe24 (8)
Child SP       IP Call Site
...

05a2e5dc 69414e7e System.Windows.Forms.Control.WaitForWaitHandle(System.Threading.WaitHandle)
    PARAMETERS:
        this (0x05a2e5e8) = 0x0275c894
        waitHandle (0x05a2e5e4) = 0x1230201c
    LOCALS:
        <no data>
        0x05a2e5f4 = 0x00000d18
        <no data>
        <no data>
        <no data>
        0x05a2e5e0 = 0x00000000
        0x05a2e5ec = 0x00000000
        <no data>
...


It’s a WebBrowser control, which makes sense as it hosts the Silverlight plugin. Okay, now we know, that Thread A is waiting for a synchronous call to finish on the thread that created the WebBrowser control. Any guess which thread that is? It’s Thread B! The one that disappeared! It doesn’t really matter what method is waiting for execution, the problem is obviously with the absence of Thread B that can’t execute anything anymore.
So what killed the message loop of Thread B? I repeated the use-case, with the following breakpoint:
!bpmd System.Windows.Forms.dll System.Windows.Forms.Application.ExitThread

But no luck. This was not invoked at all. And at this point, I made a mistake. I knew about another api – Application.Exit() – but I made the following 2 false assumptions with regards to it:
1. It does not kill my message loop if invoked from a thread different from Thread B –> FALSE
2. No one calls this, because it’s a rather aggressive way of exiting an application –> FALSE
So based on these, I was chasing ghosts for a while, e.g. looking for ThreadAbortExceptions and standard exceptions, which did help a little bit, as these revealed the following call stack while Thread B was still alive:
0:019> !clrstack
OS Thread Id: 0x3e80 (19)
Child SP       IP Call Site
0babe250 773b5b68 [InlinedCallFrame: 0babe250]
0babe24c 6a77425c DomainBoundILStubClass.IL_STUB_CLRtoCOM()
0babe250 6a9db707 [InlinedCallFrame: 0babe250] System.Windows.Forms.UnsafeNativeMethods+IOleInPlaceObject.InPlaceDeactivate()
0babe2a8 6a9db707 System.Windows.Forms.WebBrowserBase.TransitionFromInPlaceActiveToRunning()
0babe2b8 6a9db321 System.Windows.Forms.WebBrowserBase.TransitionDownTo(AXState)
0babe2e0 6ab3bd26 System.Windows.Forms.WebBrowserBase.WndProc(System.Windows.Forms.Message ByRef)
0babe310 6a24e33e System.Windows.Forms.WebBrowser.WndProc(System.Windows.Forms.Message ByRef)
0babe320 6a237201 System.Windows.Forms.Control+ControlNativeWindow.OnMessage(System.Windows.Forms.Message ByRef)
0babe328 6a2371e9 System.Windows.Forms.Control+ControlNativeWindow.WndProc(System.Windows.Forms.Message ByRef)
0babe33c 6a237130 System.Windows.Forms.NativeWindow.Callback(IntPtr, Int32, IntPtr, IntPtr)
0babe560 004aa0e1 [InlinedCallFrame: 0babe560]
0babe55c 6a289d9b DomainBoundILStubClass.IL_STUB_PInvoke(System.Runtime.InteropServices.HandleRef)
0babe560 6a288a7c [InlinedCallFrame: 0babe560] System.Windows.Forms.UnsafeNativeMethods.IntDestroyWindow(System.Runtime.InteropServices.HandleRef)
0babe598 6a288a7c System.Windows.Forms.UnsafeNativeMethods.DestroyWindow(System.Runtime.InteropServices.HandleRef)
0babe5a8 6a288993 System.Windows.Forms.NativeWindow.DestroyHandle()
0babe5ec 6a2891d8 System.Windows.Forms.Control.DestroyHandle()
0babe5f0 6aa0337b [InlinedCallFrame: 0babe5f0]
0babe664 6aa0337b System.Windows.Forms.Application+ParkingWindow.Destroy()
0babe66c 6a7c0b77 System.Windows.Forms.Application+ThreadContext.DisposeParkingWindow()
0babe670 6a7c0bf0 [InlinedCallFrame: 0babe670]
0babe6a4 6a7c0bf0 System.Windows.Forms.Application+ThreadContext.DisposeThreadWindows() 0babe6c8 6a245f75 System.Windows.Forms.Application+ComponentManager.System.Windows.Forms.UnsafeNativeMethods.IMsoComponentManager.FPushMessageLoop(IntPtr, Int32, Int32)
0babe6cc 6a245bc9 [InlinedCallFrame: 0babe6cc]
0babe754 6a245bc9 System.Windows.Forms.Application+ThreadContext.RunMessageLoopInner(Int32, System.Windows.Forms.ApplicationContext)
0babe7a4 6a245a42 System.Windows.Forms.Application+ThreadContext.RunMessageLoop(Int32, System.Windows.Forms.ApplicationContext)
0babe7d0 6a7bfbca System.Windows.Forms.Application.Run()

…

Hm… checking the source code of System.Windows.Forms.dll I found that DisposeThreadWindows() is only invoked if the message loop processes message 18 = 0x12, which turns out to be defined as WM_QUIT in "WinUser.h". You do have Windows SDK installed, don’t you? :-)

So what is sending WM_QUIT to our message loop? There are several win32 functions to achieve this, so I decided to define some native breakpoints to get my hands on the evil call stack. 
bu user32!PostMessageW "dd [esp+8] L1;.if (poi(@esp+8)!=0x12) {gc;}"
bu user32!PostThreadMessageW "dd [esp+8] L1;.if (poi(@esp+8)!=0x12) {gc;}"
bu user32!SendMessageW  "dd [esp+8] L1;.if (poi(@esp+8)!=0x12) {gc;}"
bu user32!SendNotifyMessageW  "dd [esp+8] L1;.if (poi(@esp+8)!=0x12) {gc;}"
bu user32!SendMessageCallbackW  "dd [esp+8] L1;.if (poi(@esp+8)!=0x12) {gc;}"


Okay, this requires some explanation. The debuggee is a 32-bit process, so these win32 functions are called with standard calling convention, i.e. function parameters are passed on the stack, pushed right to left, and the callee cleans the stack. When these breakpoints are hit, the following stack layout can be observed:
Object Offset
RetAddr 0 <—TopOfStack = [ss:Esp]
hWnd 0x4
Msg 0x8
wParam 0xC
lParam 0x10
…

So [ss:Esp+8] points to the message we are interested in. We always print this value and if it’s not WM_QUIT we continue execution.
I reproduced the use-case and voilà, I got lucky with PostThreadMessageW:
0:007> !clrstack
OS Thread Id: 0x42fc (7)
Child SP       IP Call Site
05ece9b8 774cddc0 [InlinedCallFrame: 05ece9b8] System.Windows.Forms.UnsafeNativeMethods.PostThreadMessage(Int32, Int32, IntPtr, IntPtr)
05ece9b4 6acb12eb System.Windows.Forms.Application+ThreadContext.PostQuit()
05ece9e8 6acb08da System.Windows.Forms.Application+ThreadContext.Dispose(Boolean)
05ece9ec 6acb10ea [InlinedCallFrame: 05ece9ec]
05ecea40 6acb10ea System.Windows.Forms.Application+ThreadContext.OnAppThreadExit(System.Object, System.EventArgs)
05ecea48 6acbffe7 System.Windows.Forms.ApplicationContext.ExitThreadCore()
05ecea54 6acb0df1 System.Windows.Forms.Application+ThreadContext.ExitCommon(Boolean)
05ecea88 6acb0269 System.Windows.Forms.Application.ExitInternal()
05eceac0 6acaf81e System.Windows.Forms.Application.Exit(System.ComponentModel.CancelEventArgs)
05ecead8 6bbb4aac ***LoginDialog.OnCancelButtonClick(System.Object, System.EventArgs)
05eceb10 012ba9b7 [MulticastFrame: 05eceb10] System.EventHandler.Invoke(System.Object, System.EventArgs)
05eceb3c 6a719366 System.Windows.Forms.Control.OnClick(System.EventArgs)
05eceb50 6a71ba1c System.Windows.Forms.Button.OnClick(System.EventArgs)
05eceb60 6acde020 System.Windows.Forms.Button.OnMouseUp(System.Windows.Forms.MouseEventArgs)
...
05ecebc8 6acba8ec System.Windows.Forms.Control.WmMouseUp(System.Windows.Forms.Message ByRef, System.Windows.Forms.MouseButtons, Int32)
05ecec28 6b02381a System.Windows.Forms.Control.WndProc(System.Windows.Forms.Message ByRef)
...


Gotcha’! This was the point I checked the docs of Exit() that was called on Thread A and resulted in exiting the message loop of Thread B and thus eventually destroying it. A little later in time Thread A got stuck as it wanted to perform something synchronously on Thread B.
The docs on msdn proved to be right: Exit() “Informs all message pumps that they must terminate, and then closes all application windows after the messages have been processed”.

Possible solutions

So how to fix this? There are many approaches, but these ones seemed to be the most appropriate:
1. Use ExitThread() instead of Exit() – this way only the message loop of the executing thread is affected.
2. Use the wpf way to enter the message loop, i.e. Dispatcher.Run(). Of course, you’ll have to change ExitThread() to something like Dispatcher.ExitAllFrames() or Dispatcher.[Begin]InvokeShutdown() to exit the loop during shutdown.

Conclusion

Creating a managed breakpoint for Application.Exit() would have showed the problematic call stack much faster. A quick search on message loop shutdown would have surely pointed this out. Oh well. That’d have been pretty boring, don’t you agree? ,-)

Thursday, 28 July 2016

WinDbg and PC games

I’ve always loved computer games. The first PC I played with was a 286 running on 20MHz in the early ‘90s. It’s interesting to recall how we referred to PCs back then. We used to say things like “I have a 286” or “mine is a 486 DX2”. All that mattered was the CPU. Other parts of the computer were practically irrelevant. Starting a game was a real challenge in some cases in MS-DOS, especially when you needed sound, mouse and cd-rom support. As conventional memory was limited to 640K, you had to carefully choose which drivers to load. Not to mention the tweaks you had to make in autoexec.bat and config.sys files e.g. to force DOS to be loaded to the Upper Memory Block. (DOS=High, UMB - Anyone?)
Then came EMS, XMS, Windows 3.1 (95, 98) and all of a sudden it became much easier to run your games. No more tweaks, yaaaaay!

WinDbg

WinDbg is a powerful debugger and disassembler. You can use it to debug processes or analyze dump files. You can even debug the Windows kernel with it. But what does it have to do with games? Well, it’s a great tool for cheating! :-)
But why cheating? Isn’t it more exciting to beat a game w/o it? Well, most of the time it is. But there are special cases. One of them is when the computer is also cheating to beat you. It happened to me too many times to be pure coincidence.
The game "Need For Speed: Most Wanted" is a good example. It’s a racing simulator from the mid 2000’s and it really pissed me off recently. No matter how accurately you drive, the game sometimes tries to compensate the clumsiness of your opponents and starts moving them with ridiculously high speeds (~900 km/h) on the map. Within moments your hope to win usually falls to pieces. Of course this usually happens in the last lap, so that you have the feeling that you’ve almost won. Very cheeky.
Another pesky situation is when cars in traffic decide to suddenly maneuver to block your way and usually in the most critical situations when you are absolutely not allowed to make any mistakes.
And my "favourite" one: opponents / police cars can actually maneuver while being airborne. Should you try it however, you end up bouncing / rolling / crashing, i.e. losing precious seconds.
Being a programmer I just couldn’t accept this. The odds should be balanced properly. So I decided to do something about it.

The cheat begins

Okay, so the game is about beating the top 15 most wanted street racers in order to be nr #1. In order to challenge one, you need to collect a certain amount of bounty. However, this can be very difficult to achieve because of the abovementioned reasons. So I started off with opening the appropriate save game file with a hex editor. You should find it in %USERPROFILE%\Documents\NFS Most Wanted.
You can have several cars in the game. Each has a bounty on its own. I had 3 cars, so I chose the one with the most unique bounty value, which was 3051800 (0x2E9118). Uniqueness is very important, as it makes it easier to find the right value that needs to be changed. I was lucky as there was only a single occurrence of this value in the save game file.
Note: 0x2E9118 is a 32-bit value. In order to find it, you’ll have to play a bit with the order of the hex digit pairs. 0x2E9118 = 0x00 2E 91 18 –> 18 91 2E 00 <—this is how you can find it in your favourite hex editor. The reason behind it is that multi-byte values are stored in memory differently than on disk. For 16-bit values, like 0xABCD = 0xAB CD –> CD AB should be used. This rule does not apply to searching for a value in memory.
Warning: always backup your files before editing. You don't wanna lose your progress in the game if something goes wrong, do you?
I found the value so I changed it to 4000000, i.e. from 18 91 2E 00  --> 00 09 3D 00. Saved the file, started the game, loaded my profile and….BAAANG!!! "Your profile appears to be damaged and cannot be used". Great. It seems the save game contains some kind of hash (like a sha-1 message digest) that should be updated to reflect the changes I've made. A typical protection from that era. Unfortunately, I had no idea what hash algorithm was used and on what input data. And I needed a quick solution. Conclusion: this approach was a dead end.
Hm… now what?
We need a different approach. How about trying to edit this value in memory after loading the original save game? This is where WinDbg comes into the picture. I restored the save game from the backup, loaded my game, started the 32-bit version of WinDbg - as the game was also 32-bit - and attached to speed.exe.
So how to find 0x2E9118 in memory? As it is a 32-bit process, the full address space of it can be scanned through very quickly.

0:000> !address -c:"s -d %1 %2 2E9118"

This command iterates over all memory regions of the virtual address space of the process and scans for the value in them. %1 and %2 are placeholders that are replaced with the base address and end address+1 of the actual memory region.
Note: for an x64 process you might want to use some filters to search only the heap regions for instance. That would be:

0:000> !address –f:Heap -c:"s -d %1 %2 2E9118"

For me the output was:

03430274  002e9118 0000000e 00020000 000b0000  ................

The address in bold is the one we need, but let's verify it once again with the display memory command (dd):

0:000> dd 03430274  L1
03430274  002e9118

The dd command displays 32-bit values starting at the address we provide it with.
Now let's convert 4000000 to hexadecimal:

0:000> ? 0n4000000
Evaluate expression: 4000000 = 003d0900

Okay, now we know the memory address to change and the desired value. So let's run the edit memory command (ed):

0:000> ed 03430274  003d0900

Verify our success:

0:000> dd 03430274  L1
03430274  003d0900

And that's it! You can now safely detach from the process and save your game to persist the changes. There's only one thing left: to enjoy the results. Who's smarter now, Mr. Game? ;)

The story continues

A few days later, the game challenged me once again. In order to race against the top 5 black list members, you need to pass several criteria, one of which is about hitting a certain number of milestones. Milestones are usually things like escaping from police chases, evading roadblocks and causing trouble in the public. The longer the chase the more bounty you get. Collecting several hundreds of thousands of bounty can be quite a challenge. It can be very annoying when you get busted by the police after a looong chase. So why not start a chase and give ourselves a nice large bounty ASAP?
Beware game, WinDbg is coming to aid me again. :)
Sooo, I ran the game, loaded my profile and started a chase. It's very easy to avoid getting busted for 1-2 minutes, so I did that to make sure my bounty was unique enough to be sought in memory.
Then I switched to WinDbg, pressed Ctrl-Break to break into the debugger and tried to find the value (4000):

0:000> ? 0n4000
Evaluate expression: 4000 = 00000fa0
0:000> !address -c:"s -d %1 %2 00000fa0"
00010228  00000fa0 00000000 00000000 00000000  ................
0023014c  00000fa0 037c0048 00000080 00000001  ....H.|.........
0028014c  00000fa0 00000000 00000080 00000001  ................
002f0228  00000fa0 00000000 00000000 00000000  ................
002fc498  00000fa0 00000000 0000000a 00000008  ................
<stripped ~340 occurrences for brevity>

Whoaaa! A whole bunch of occurrences. I had to resort to a neat trick. I resumed the game and escaped for another 10 seconds, i.e. until the bounty value changed. The new value was 4500.

0:000> !address -c:"s -d %1 %2 0n4500"
003064e8  00001194 00000000 00000008 00000008  ................
006289e0  00001194 283daa74 74000023 34bc3da3  ....t.=(#..t.=.4
00dfa3cc  00001194 9ee9006a 3b000000 0000888e  ....j......;....
00e10110  00001194 a3e85653 8300013e 50e910c4  ....SV..>......P
0120a298  00001194 00000000 00000000 40005008  .............P.@...
<stripped ~80 occurrences for brevity>

The intersection of the sets created from the 1st columns of these outputs gives us a set with a single memory address: 0bed3ba4. So let’s boost our bounty to 65536 for testing purposes:

0:000> ed 0bed3ba4  10000
0:000> g

Testing, and…. it doesn’t work. Hmm… is the value we set still intact?

0:000> dd 0bed3ba4  L1
0bed3ba4  00001194

What?! Something altered my value. Dang! Let’s create a breakpoint that fires when someone tries to write the memory address in question.

0:000> ed 0bed3ba4  10000
0:000> ba w4 0bed3ba4
0:000> g

Very soon, I got this:

Breakpoint 0 hit
eax=00001194 ebx=02d44f48 ecx=0bed3b68 edx=00892988 esi=0bed3b68 edi=008a2428
eip=00568eac esp=0018fda0 ebp=0bf375f8 iopl=0         nv up ei pl nz ac pe nc
cs=0023  ss=002b  ds=002b  es=002b  fs=0053  gs=002b             efl=00200216
speed+0x168eac:

Great, now let’s check the surrounding assembly code (near cs:Eip) by leveraging the "u" (disassemble) command.

0:000> u eip-0x30 L16
speed+0x168e7c:
00568e7c cc              int     3
00568e7d cc              int     3
00568e7e cc              int     3
00568e7f cc              int     3
00568e80 8b442404        mov     eax,dword ptr [esp+4]
00568e84 394134          cmp     dword ptr [ecx+34h],eax
00568e87 7403            je      speed+0x168e8c (00568e8c)
00568e89 894134          mov     dword ptr [ecx+34h],eax
00568e8c c20400          ret     4
00568e8f cc              int     3
00568e90 8a442404        mov     al,byte ptr [esp+4]
00568e94 384138          cmp     byte ptr [ecx+38h],al
00568e97 7403            je      speed+0x168e9c (00568e9c)
00568e99 884138          mov     byte ptr [ecx+38h],al
00568e9c c20400          ret     4
00568e9f cc              int     3 
00568ea0 8b442404        mov     eax,dword ptr [esp+4]
00568ea4 39413c          cmp     dword ptr [ecx+3Ch],eax 
00568ea7 7403            je      speed+0x168eac (00568eac)
00568ea9 89413c          mov     dword ptr [ecx+3Ch],eax
00568eac c20400          ret     4
00568eaf cc              int     3

I have to admit, you’ll need some assembly language knowledge here. The code in red tells me, that the top of stack+4 contains a value that is compared with the contents of our memory address and rewrites it if necessary. Ooookay, there are several options to circumvent this, so let’s choose one: find the code that pushes the reference value to the stack. The "gu" command runs the code until the next return statement is executed.

0:000> gu
eax=00001194 ebx=02d44f48 ecx=0bed3b68 edx=00892988 esi=0bed3b68 edi=008a2428
eip=006f19c4 esp=0018fda8 ebp=0bf375f8 iopl=0         nv up ei pl nz ac pe nc
cs=0023  ss=002b  ds=002b  es=002b  fs=0053  gs=002b             efl=00200216
speed+0x2f19c4:
006f19c4 8b6c2418        mov     ebp,dword ptr [esp+18h] ss:002b:0018fdc0=0bf375f8

Let’s check around cs:Eip again:

0:000> u eip-0x30 L16
speed+0x2f1994:
006f1994 57              push    edi
006f1995 088b44242c8b    or      byte ptr [ebx-74D3DBBCh],cl
006f199b 16              push    ss
006f199c 50              push    eax
006f199d 8bce            mov     ecx,esi
006f199f ff520c          call    dword ptr [edx+0Ch]
006f19a2 8b5500          mov     edx,dword ptr [ebp]
006f19a5 8b3e            mov     edi,dword ptr [esi]
006f19a7 8bcd            mov     ecx,ebp
006f19a9 ff5244          call    dword ptr [edx+44h]
006f19ac 8b5500          mov     edx,dword ptr [ebp]
006f19af 8bcd            mov     ecx,ebp
006f19b1 89442440        mov     dword ptr [esp+40h],eax
006f19b5 ff5240          call    dword ptr [edx+40h]
006f19b8 8b4c2440        mov     ecx,dword ptr [esp+40h]
006f19bc 03c8            add     ecx,eax
006f19be 51              push    ecx
006f19bf 8bce            mov     ecx,esi
006f19c1 ff573c          call    dword ptr [edi+3Ch]
006f19c4 8b6c2418        mov     ebp,dword ptr [esp+18h]
006f19c8 8b4c2414        mov     ecx,dword ptr [esp+14h]
006f19cc 8b4974          mov     ecx,dword ptr [ecx+74h]

Ahha! The code in red pushes the reference value to the stack. So why not create a breakpoint for the address of the push statement (006f19be) and alter the Ecx register beforehand?

0:000> bd *
0:000> bp 006f19be "r ecx=0x00010000;g;"

The "bd *" command disables all previous breakpoints. The "bp" command sets our new breakpoint and a command that runs automatically when it is hit.

And that was it. This hack resulted in a bounty value of 65536 (while in the chase), the only thing left was to successfully escape from the cops. Pretty neat, huh?